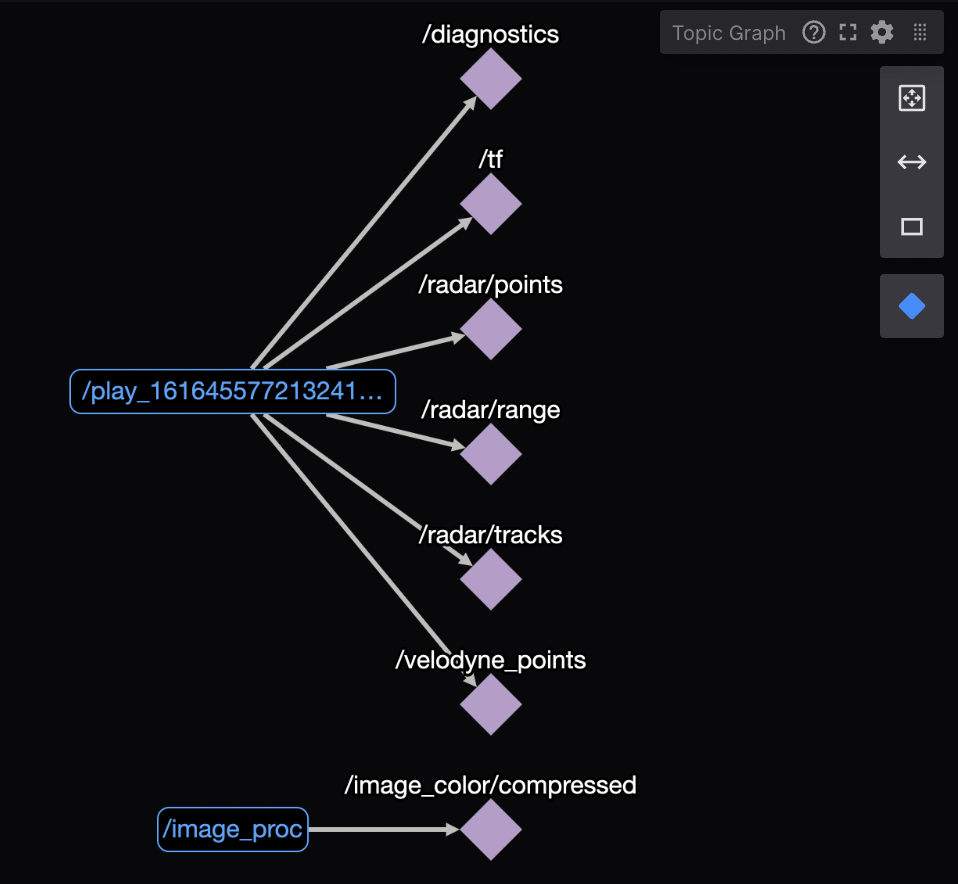
Display a graph visualization of the current node and topic topology.
To use this panel, you must be connected to a live ROS system via a native or Rosbridge connection. Use the native connector for best results.
The graph will show nodes, topics, and services. Nodes implement services, and either subscribe or publish to topics. The direction of the graph's arrows will denote whether a node is subscribing to or publishing a topic.
- Nodes – blue rectangles
- Topics – purple diamonds
- Services – red rectangles
User interactions
If any items in the graph are overlapping, click and drag to reposition them for easier viewing.

Use the available controls to accomplish the following:
Zoom fit – Fit the graph within the viewport
Orientation – Toggle the graph's orientation
Showing services / Hiding services – Toggle the visibility of the services
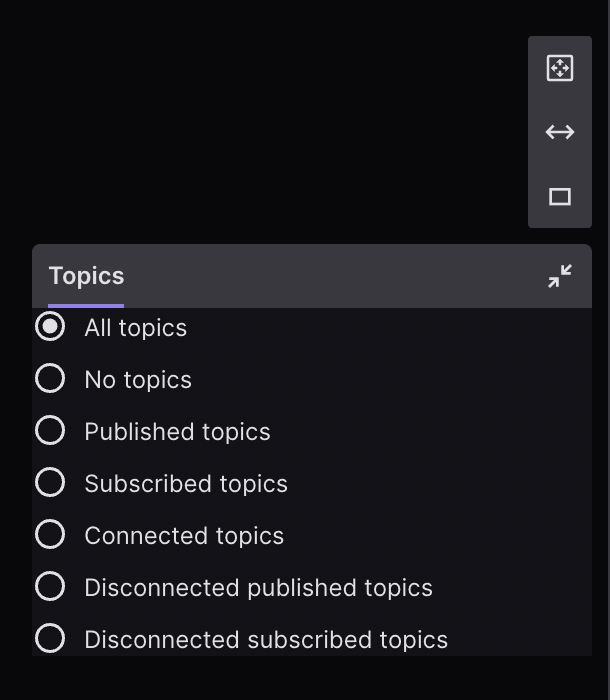
Showing x topics – Toggle between displaying different groups of topics

Shortcuts
- Scroll – Zoom in and out
